Which U.S. cities are setting the gold standard for quality of life?
To mark July as National Park and Recreation Month, LawnStarter ranked 2024’s Leading Cities for Quality of Life.
We compared 500 of the biggest U.S. cities based on 16 categories. We considered life expectancy, unemployment rates, state rankings of workers’ rights, and food security, among 53 total metrics.
See where your city landed below. To learn how we ranked the cities, see our methodology.
Contents
City Rankings
See how each city fared in our ranking:
Top 5 Close Up
Check out the slideshow below for a closer look at each of our top 5 cities.
1st = Highest Quality of Life
Key Insights
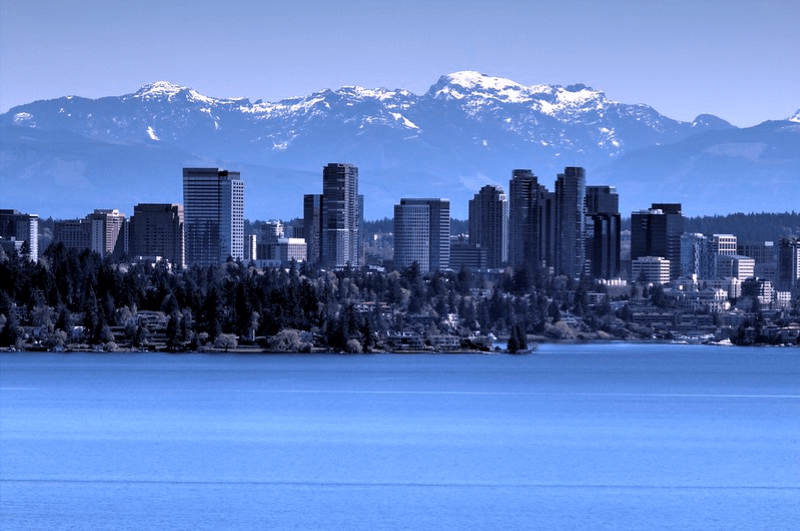
Cities from the West Coast, particularly in Washington and California, offer greater employment protections and plenty of social and personal freedoms. Redmond, WA, (No. 1) and Bellevue, WA, (No. 4) provide overall quality of life but struggle with low percentages of sunshine, impacting vitamin D levels and depression rates.
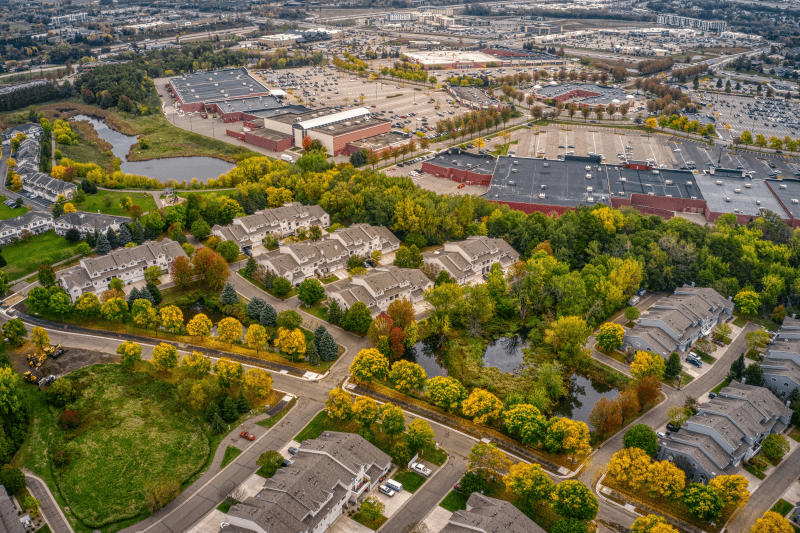
Affluent suburbs of big Midwest cities, like Woodbury, MN, (No. 3), Carmel, IN, (No. 6), and Naperville, IL, (No. 14) offered surprising findings concerning affordable housing. All three cities finished near the top for the category. Residents also enjoy low poverty levels and high purchasing power.
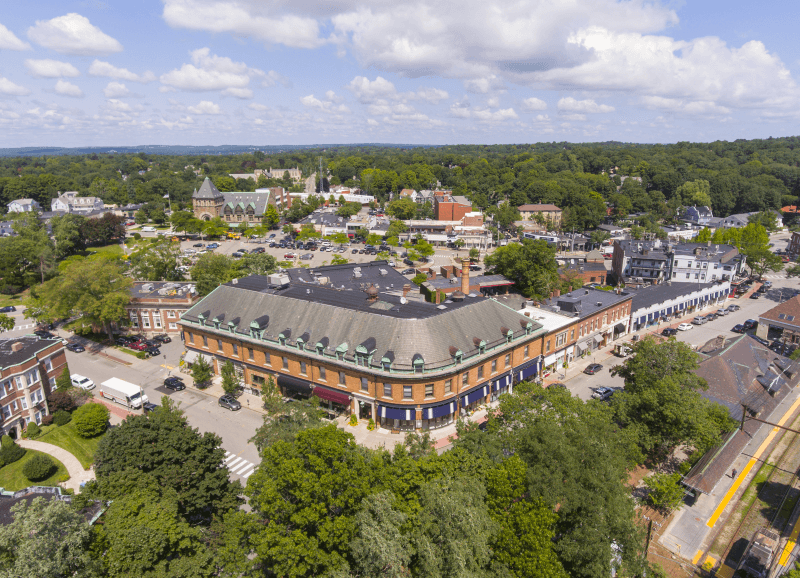
Educational powerhouses in the Northeast: Newton, MA, (No. 2), Cambridge, MA, (No. 26), and New York, NY, (No. 193) excel in education and good mental health. Despite these strengths, 35% of Massachusetts and New York cities featured landed in the bottom half of the ranking. These cities face challenges with housing affordability and congestion. The high cost of living and dense urban environments impact overall satisfaction and quality of life.
Flint, MI, (No. 500) and Detroit, MI, (No. 499) provide the lowest quality of life, reflecting severe challenges with family and food security, economic stability, housing, and infrastructure. Both cities face significant economic hardships, making substantial improvements necessary to enhance residents’ well-being. While this study reflects the latest available data, it may not fully capture recent big investments and efforts aimed at Detroit’s turnaround.
Discover more details below.
Ask the Experts
We turned to a panel of experts to understand the critical factors contributing to a high quality of life and the potential impacts of various environmental and economic conditions.
- What are three key factors that contribute to a high quality of life in urban areas?
- How do environmental factors, such as air quality and green spaces, influence the quality of life in a city?
- What are three ways urban planning and infrastructure impact residents’ quality of life?
- How do economic variables like employment rates and cost of living affect the overall quality of life in different cities?
- What role do educational opportunities and institutions play in determining the quality of life in a city?
- How do access to healthcare and public health services contribute to the quality of life in urban populations?


What are three key factors that contribute to a high quality of life in urban areas?
Because quality of life should be for all people, I would rate the most important factor as housing costs relative to wages. Because I value urbanism, a second factor would be the walkability and density of restaurants, shops, and services. A city’s walk score or transit score captures this pretty well. Third, parks and trails are essential to a high quality of life. I grew up in Minneapolis and all of my Minneapolis friends would agree that the park and parkway system was what made Minneapolis a great place to live.
How do environmental factors, such as air quality and green spaces, influence the quality of life in a city?
Once a society achieves relative safety and a comfortable standard of living, a clean environment and access to natural areas become two of the most desired characteristics of a good place to live. We live in an era when large numbers of well-paid workers are employed in the knowledge economy and can live wherever they want to. Quality of life and especially environmental quality and outdoor recreation opportunities, then, become major factors in the choice of where to live.
What are three ways urban planning and infrastructure impact residents’ quality of life?
Parks and infrastructure decisions shape urban life for centuries to come. Minneapolis is a beneficiary of an 1883 recommendation by planner H.W.S. Cleveland to create a system of linked parks and parkways. Chicago residents benefit from urban planner Daniel Burnham’s 1909 Plan of Chicago which called for a continuous park along the Lake Michigan waterfront. Today, cities across the United States are trying to figure out how to undo the damage wrought by building interstate highways through inner-city communities in the 1950s and 1960s.
How do economic variables like employment rates and cost of living affect the overall quality of life in different cities?
When considering the quality of urban areas, we need to ask “high quality of life for whom?” Urban areas that offer a high quality of life for affluent households might be out of reach for average earners. Or an urban area might offer a great quality of life for singles and double income no kids couples (DINKS) but cities need to emphasize the quality of life for families raising the next generation of children. When we map domestic moves within the United States, we can see the push factors of high housing costs and high taxes and the pull factor of strong employment opportunities.
What role do educational opportunities and institutions play in determining the quality of life in a city?
The presence of a local research university is a strong predictor of regional success in today’s information economy. The economic and demographic turnaround of a city like Pittsburgh is inconceivable apart from Carnegie Mellon University and the University of Pittsburgh. But even regional universities and liberal arts colleges can contribute a great deal to quality of life when communities partner with universities and make themselves attractive so that university graduates choose to stay when they start their careers.

What are three key factors that contribute to a high quality of life in urban areas?
Urban neighborhoods that consistently delight and serve their residents well, tend to share these characteristics:
- People-friendly streets: Narrow, tree-lined, quiet, car-free or car-light streets
- Density: Enough residents and workers within a half-dozen to a dozen blocks to support key businesses and amenities, like bakeries, doctor’s offices, day-care, coffee shops, a public library, etc.
- Public space: Shared areas that offer gathering places, social activities, nature, and athletics.
How do environmental factors, such as air quality and green spaces, influence the quality of life in a city?
People like being in places that are quiet, safe, and pleasant. In cities, that mostly means keeping cars out, since they are the main sources of noise, air pollution, and physical danger. Less space devoted to highways, wide streets and parking also means more room for shared green space.
In the U.S., urban green space outside of stand-alone parks usually consists of strips of sterile set-backs or postage-stamp yards. Anyone who’s traveled abroad has seen a more attractive alternative. Picture a block lined with multi-family apartments, each unit on a single floor where the living room looks out over the street, while the bedrooms in the back open onto a shared courtyard for the whole block. Plenty of room to combine amenities: restaurant patio, playground, community garden, picnic area, clotheslines, and just some shaded green space to relax in.
What are three ways urban planning and infrastructure impact residents’ quality of life?
A well-functioning community with a consistent built environment won’t happen if every property owner is making completely independent decisions. Planning and some basic rules are needed to make streets work for everyone, to get enough density for a walkable neighborhood to be largely self-sufficient, or to combine available green space into communal areas that serve multiple needs (not just private lawns).
Less visible infrastructure also matters, often under the street: district-energy systems that reduce everyone’s energy cost and environmental footprint, separated stormwater and sewer pipes for water and energy recovery; or high-bandwidth internet “pipes” consistently available in every part of town.
How do economic variables like employment rates and cost of living affect the overall quality of life in different cities?
This question is actually slightly backwards. The built form of the city has a huge influence on access to jobs and on the cost of housing and transportation. A low-density urban area that is entirely dependent on cars and highways will be congested and disconnected. People with cars will suffer from long commutes and the high cost of vehicle ownership; people without cars, because they can’t afford them or physically can’t drive them, will suffer from reduced employment opportunities and lack of community support. Plus separated dwellings are the most expensive kind of housing.
In other words, cities with dense, walkable, car-light and transit-rich neighborhoods (which already offer a high quality of life for their residents and workers) will also lead to lower costs of living and higher employment.
What role do educational opportunities and institutions play in determining the quality of life in a city?
The public schools are the foundation for any community’s ultimate success. Good quality schools with enough resources and with diverse students and educational offerings mean families will want to stay in a neighborhood for the long term, kids will get to form life-long bonds with the neighborhood and with each other, and employees and community members will have the skills to succeed and prosper and to participate in community institutions.
College campuses can also integrate successfully into the urban fabric and provide an economic and cultural engine for the broader community, as long as they’re not walled off islands that physically separate a neighborhood. In fact, some college campuses are idyllic models of good neighborhoods: everything you need is within easy walking distance, with lots of shared green space and community resources.
How do access to healthcare and public health services contribute to the quality of life in urban populations?
I’m not an expert on public health. But I am writing this in the midst of a nasty heat wave, deadlier than a major hurricane. So here’s an important health benefit that cities offer to everyone: people who live in cities have a small fraction of the carbon footprint of people who live in low-density suburbs and exurbs. As the climate crisis deepens, we’re going to see ever-worsening public health impacts. Well-designed cities can play a crucial role in creating a low-carbon future.

What are three key factors that contribute to a high quality of life in urban areas?
Equality of opportunity, equal access to services, and the ability to affect change. All residents should have the ability to succeed and thrive in an urban area, economically and otherwise. Residents are entitled to receive services on an equal basis regardless of their demographic characteristics or where they live, and cities with high quality of life embrace this as a core duty. Finally, if residents feel that they have the capacity to bring about positive change in the direction of their city, they will perceive it as a healthy measure of their quality of life.
How do environmental factors, such as air quality and green spaces, influence the quality of life in a city?
Environmental factors have direct implications for people’s health and the quality of life in a city. For example, cities with high levels of lead in water, air, or paint adversely impact the health of their children, with reduced cognitive abilities, lack of impulse control, and severe health issues among the detrimental effects that have been documented in health research. Diminished air quality has also been found to lead to high levels of asthma and other pulmonary impairments. Cities that do not provide greenspaces for residents on an equal basis deprive them of the opportunity to enjoy natural settings that reduce stress, improve health, and absorb pollutants from urban life.
What are three ways urban planning and infrastructure impact residents’ quality of life?
Urban planning and infrastructure can not only impact the quality of life of residents but they can be oriented toward providing the highest quality of life for residents. First, urban planning should provide a sufficient and equitable amount of green space that meets the needs of residents for respite from the built environment while reducing air and water pollution. Second, cities should be built around public transportation options, rather than personal auto use, to increase safety, allow for walkable use of the cityscape, and reduce pollution. Third, new housing should be built near public transit to encourage residents to forego auto use within the city.
How do economic variables like employment rates and cost of living affect the overall quality of life in different cities?
When cities have viable economies with the opportunity for entering the workforce and for advancement on an equitable basis, residents feel as if they are included in the life of the city in a way that persistently high levels of unemployment do not. Similarly, if the cost of living is affordable for the area, it allows for employment flexibility and opportunities for upward mobility.
What role do educational opportunities and institutions play in determining the quality of life in a city?
Educational opportunities and institutions play a vital role in ensuring an educated workforce for a city. An educated citizenry can understand how to advocate for the quality of life they desire in the public and private sectors. A strong public education sector that leads to a variety of opportunities for higher education will contribute to a quality of life that is dynamic and vibrant for residents of an urban area.
How do access to healthcare and public health services contribute to the quality of life in urban populations?
Healthcare and high-quality public health services are critical to how people experience their quality of life in urban areas. Health challenges are inevitable and the ability of facilities in an area to address them equitably removes a major stressor from the lives of citizens, one that significantly impacts upon quality of life. Urban areas where residents can access both basic and specialized care allow residents to deal with the consistent and ongoing maintenance of their health as well as any extraordinary events in a way that prioritizes their well-being and their participation in city life.
Methodology
First, we determined the factors (metrics) that are most relevant to rank the Leading Cities for Quality of Life. We then assigned a weight to each factor based on its importance and grouped those factors into 16 categories: Environment, Air and Water Quality, Housing and Infrastructure, Healthcare Access, Physical Health, Mental Health, Economic Stability, Employment Protection, Housing Affordability, Safety, Education, Leisure Time, Recreational Facilities, Social and Personal Freedoms, Family and Food Security, and Health and Wellness Access. The categories, factors, and their weights are listed in the table below.
For each of the 500 biggest U.S. cities, we then gathered data on each factor from the sources listed below the table.
Finally, we calculated scores (out of 100 points) for each city to determine its rank in each factor, each category, and overall. A city’s Overall Score is the average of its scores across all factors and categories. The highest Overall Score ranked “Best” (No. 1) and the lowest “Worst ” (No. 500).
Notes:
- The “Worst” among individual factors may not be No. 500 due to ties.
- Note: We are aware wildfires currently are sweeping California and heatwaves are baking scores of cities across the U.S. We based our ranking on the most recent data from all of the sources linked below.
Sources: Other LawnStarter Studies, Global Forest Watch, National Centers for Environmental Information, Numbeo, U.S. Environmental Protection Agency, County Health Rankings & Roadmaps, U.S. Census Bureau, Health Resources & Services Administration, Centers for Medicare & Medicaid Services, Centers for Disease Control and Prevention, Census Business Builder, OXFAM, National Center for Children in Poverty, Federal Housing Finance Agency, Neighborhood Scout, Gun Violence Archive, U.S. Department of Transportation, Data Express, Walk Score, careeronestop, IPUMS Time Use, AllTrails, Trust for Public Land, Yelp, Playground Buddy, Center for Reproductive Rights, Human Rights Campaign, Movement Advancement Project, and Feeding America
Final Thoughts
Today, quality of life varies significantly across U.S. cities, influenced by various social, economic, and environmental factors. Residents in cities with lower quality of life often face challenges like poor air and water quality, limited healthcare services, and economic instability, all affecting overall well-being.
Efforts to enhance quality of life are underway in many areas. Local governments are investing in green spaces, improving healthcare infrastructure, and promoting economic development to create more livable cities.
The Affordable Care Act continues to address disparities in healthcare access nationwide, and federal initiatives aim to curb pollution and protect natural resources.
Improving the quality of life in America’s cities requires a multi-faceted approach. Individuals can also contribute to their community’s well-being through small, impactful actions.
Explore some tips below to enhance your quality of life and contribute to a healthier community:
- Improve your health and air quality by biking, walking, or taking public transportation.
- Plant a tree to improve the environment and combat local tree cover loss.
- Conserve energy by using energy-efficient appliances, investing in an electric vehicle, and installing solar panels.
- Reduce waste by composting.
- Volunteer at community gardens, local centers, or schools to support education, food security, and recreational activities.
- Join a Neighborhood Watch program to enhance community safety.
- Support local businesses to boost the local economy and create jobs.
Hire a local LawnStarter crew to help create a healthier and more enjoyable outdoor space, contributing to your quality of life.
Media Resources
Quotes from LawnStarter Editor-in-Chief Jeff Herman
- Southern cities, including those in Texas, Louisiana, and Georgia, faced challenges across many areas. Only 42 cities made it into the top half of the ranking. Among the bright spots were Alexandria, VA, which shined at No. 33 overall and took the top spot in Education, and Frisco, TX, which impressed with a second-place finish in Economic Stability, landing it at No. 62 overall. Living in Dallas, I can vouch for Frisco’s quality of life in a uniquely Texas way: Frisco was one of the first cities in DFW to get an H-E-B.
- Carmel, IN, at No. 6 is not a shock, as I worked two stints in Indianapolis over the years. The City of Traffic Circles has great schools, clean air, and lots of green space. Those who could afford to live there were in some ways the envy of many across the Indianapolis metro area. The life-size bronze sculptures downtown are a nice touch.
- Anchorage, AK, (No. 286) was a surprising performer with great natural wonders but some climate and urban challenges. Despite containing over half of the nation’s wilderness, Anchorage struggles with environmental factors, particularly a low percentage of sunshine and sustainability.
- Augusta, GA, (No. 407) excels in Safety (No. 1), but finished near the bottom of our Quality of Life ranking due to poor economic stability, education, and food security.
- Progressive tech giants in the West, San Francisco (No. 23) and Seattle (No. 15), boast excellent rankings in Physical Health and Social and Personal Freedoms. These sustainable cities offer low obesity and physical inactivity rates as well as green space initiatives.
- Southeastern cities like Cary, NC, (No. 49), Charleston, SC, (No. 180), and Durham, NC, (No. 172) boast education opportunities, plenty of leisure time, and affordable housing. Unfortunately, the Carolinas offer some of the worst employment protections and are a mixed bag when it comes to healthcare access.
- Among the bottom 25, 12 cities are in Texas, with cities spread across various regions including the Gulf Coast and Rio Grande Valley. This widespread distribution highlights significant regional challenges, from healthcare access to economic stability.
• High-resolution images of cities
Main Photo Credit: Jill Evans / Pexels / License


